|
Subproblem 4a - Page 3 of 4 |
ID# C304A03 |
Sub-problem 4a:
Northbound Left-Turn Capacity
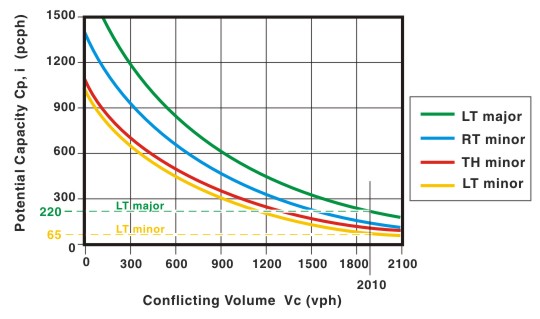
Exhibit 3-27
shows several plotted lines
representing the different minor movements at an unsignalized intersection. The dashed
horizontal lines near the bottom of the graph identify the estimated
potential capacity for both the minor street left-turn movement (shown as a
yellow dashed line and depicting the northbound left-turn from Krome Avenue
onto Okeechobee Road), and also the major street left-turn movement (shown
as a green dashed line and depicting the westbound left turn from Okeechobee
Road onto Krome Avenue). Both of these capacity estimates are based on the
projection that there will be a conflicting volume of about 2,010 vehicles
during the peak hour for the first stage of the minor street left-turn movement (see
Exhibit 3-25).
|
 |
|
Exhibit
3-27. Potential capacity of a stop-controlled movement as a function of
the conflicting traffic volume. (Source: HCM Exhibit
17-7). |
The minor street (northbound) left-turn's estimated capacity of
65
vph is considerably less than the peak hour demand of 257 vph, confirming
the capacity deficiency we observed in the
photo.
Conversely, the estimated capacity of the major street (westbound) left turn
(220
vph) appears sufficient to accommodate the peak hour demand of 120 vph.
[
Back ] [ Continue ] with
Sub-Problem 4a