Problem 1: Rietz Union Drive Intersection We can start to study the corridor by looking at each intersection and analyzing the current and planned conditions as a way of developing alternatives to mitigate any deficiencies, initially at the intersection level. To begin, we will first analyze existing operations, then proceed to add improvements to quantify their effects to help select the best set for implementation. Using the existing traffic levels and geometric conditions, we can compute the delays and level of service at this intersection, currently unsignalized, operating under two-way stop-control (TWSC). As we work through these computations, we will be able to learn about several aspects of a TWSC intersection in Sub-problem 1a, including the effects of pedestrians blocking the minor approaches. We will compare the results from the analysis of existing conditions with those using projected traffic volumes generated from the new parking structure. We will then investigate some alternatives using information about the queuing lengths of different movements, as well as delays and LOS for movements and approaches. |
Page Break
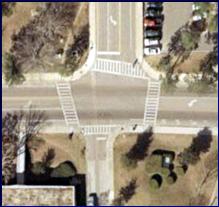
| Exhibit 5-9. Reitz Union Drive/Museum Road Intersection |
|
|
Page Break
Problem 1: Rietz Union Drive Intersection Next, we will consider whether signal control offers a viable solution to the future conditions by analyzing the intersection controlled by a traffic signal in Sub-problem 1b to:
In Sub-problem 1c, we will consider the effects of pedestrians and bicycles on the signalized intersection, then look at geometric improvements to mitigate any negative effects. So, we will analyze:
We can then compare the overall operation of the TWSC versus the signalized intersection to better understand and recommend which implementation offers the better solution. Our goal in Problem 1 is to investigate a variety of possible small-scale solutions to help alleviate the congestion created by the traffic generated by the new parking structure. Subsequent problems will look at the other alternatives for this intersection (in Problem 2). |
Page Break
Sub-problem 1a: Analysis of the Existing TWSC Intersection Step 1. Setup In consideration of this analysis, we must first recall the importance of this facility as a multimodal corridor. The presence of pedestrians on this corridor will present some challenges for our analysis. In this problem, we will also interpret results from the HCM methodology, translating results that are mere mathematical equations to more meaningful results to present to the stakeholders involved in the project. Here are some issues to consider as you proceed with the analysis of the existing intersection and its performance.
Discussion: |
Page Break
Sub-problem 1a: Analysis of the Existing TWSC Intersection Step 2. Results What is the data that is needed for this analysis? We can set up this analysis by compiling data on the existing conditions for use in a standard HCM application using the procedures in Chapter 17 for Unsignalized Intersections. The Two-Way Stop-Control (TWSC) methodology requires typical data, such as:
The volume data for this analysis are shown below in Exhibit 5-10 and Exhibit 5-11.
|
|||||||||||||||||||||||||||||||||||||||||||||||||||||||||||||||||||||||||||||||||||||||||||||||||||||||||||||||||||||||||||||||||||||||||||||||||||||||||||||||||||||||||
Page Break
Sub-problem 1a: Analysis of the Existing TWSC Intersection Step 2: Results What is the level of service of this unsignalized intersection today? In the future? Results of our TWSC analysis of the Museum Road/Reitz Union intersection under existing conditions are shown in Exhibit 5-12 below.
As you can see, the most pertinent information gained from this exercise might be the delay and level of service experienced by the SB movements, which we expect to be intensified by the addition of traffic for the new parking structure. Another item to note is that the northbound approach shows LOS F; but with so few vehicles, a field visit would show no queues or apparent problems. This is because LOS is based on delay in seconds per vehicle without regard to the number of vehicles being affected. How might you interpret the estimates of delay at an unsignalized intersection to acknowledge the limitation of the methodology? While the queue and delay estimates are what the HCM methodologies provide, one might consider whether 999 seconds of delay is realistic. Essentially, this value is calculated from the equation in the HCM, and one might question whether a vehicle would actually experience over 18 minutes of delay during the peak 15 minutes. For this reason, reporting that the delay is greater than the upper threshold of LOS (>50 sec) would probably be more appropriate. For further detail, see page 17-26 in the HCM. What is the effect of pedestrians on the intersection? One area worth a closer look would be the effects of high pedestrian volumes. Comparing the results with the high pedestrian volumes to a similar run without pedestrian interference will help illustrate the effects this aspect of the intersection has on the results. This comparison of queue, delay, and LOS is shown in Exhibit 5-13. |
||||||||||||||||||||||||||||||||||||||||||||||||||||||||||||||||||||||||||||||||||||||||||||
Page Break
Sub-problem 1a: Analysis of the Existing TWSC Intersection
The effects of pedestrians on queues, delay, and even LOS can be dramatic. Exhibit 5-13 shows that, when pedestrians were considered, delays for the northbound and southbound approaches increased very substantially. This correctly reflects the effects of time blockage (21% on three approaches) created by pedestrians at the stop-controlled approaches. The results of this sensitivity analysis also emphasize the importance of considering pedestrian effects in this particular case study, or in any situation where pedestrian volumes can be expected to be significant. Assuming the geometry and pedestrian volumes remain unchanged from existing conditions, we can perform an analysis on the TWSC intersection with projected traffic levels reflecting the additional volumes generated by the new parking structure. Exhibit 5-14 provides details on queue, delay, and LOS, comparing the current condition with projected traffic and no improvements to the intersection:
Obviously, the effects of the projected additional traffic have been to exacerbate the deficiencies previously identified in Exhibit 5-13. Delays listed as 999 seconds per vehicle represent values where parameters, such as the v/c ratios, drive the delay calculation to very high (>999 sec/veh) values. Such high delay values are not realistic outcomes in the real world, and reflect the reasonable conclusion that demand volumes are likely to change before delays of this magnitude are reached. Also notice that the queue lengths have become substantially greater under the projected future conditions. The numerical analysis results are not as important here as the conclusion that, without mitigation, this intersection is likely to operate unacceptably whether or not additional traffic is realized from the proposed development. |
||||||||||||||||||||||||||||||||||||||||||||||||||||||||||||||||||||||||||||||||||||||||||||||||||||||||||||||||||||||||||||||||||||||||||||||||||||||||||||||||||||||||||||||||||||||||||||||||||||||||||||||||||||||||||||||||||||||||||
Page Break
Sub-problem 1b: Analysis of the Signalized Intersection with Projected Traffic Step 1. Setup We know from the results of Sub-problem 1a that, with or without the projected traffic from the proposed development, the TWSC intersection of Museum Road and Reitz Union will experience substantial delays and queues. In this sub-problem, we will investigate the possibility of signalizing the intersection to determine if that would improve the situation. As noted previously, this is an analysis to reveal the likely operational effects of signalizing the intersection. A signal warrant analysis using the procedures defined in the MUTCD would normally be necessary prior to pursuing this option. Here are some issues to consider as you proceed with a signalized analysis of the existing intersection and its performance.
Discussion: |
Page Break
Sub-problem 1b: Analysis of the Signalized Intersection with Projected Traffic What data is needed for this analysis? To analyze this intersection under signal control, the following data is required:
HCM Chapter 16 prescribes an operational method for evaluating signalized control of an intersection, relying on the input data identified above. Here, the HCM method will be applied to evaluate the expected performance characteristics of the intersection under signal control. |
Page Break
Sub-problem 1b: Analysis of the Signalized Intersection with Projected Traffic Step 2: Results A comparison of operations between a TWSC and a signal controlled intersection with existing traffic and geometry would be informative, and would also provide some data for further comparisons later. The results, including queue, delay, and LOS (assuming an actuated signal running an average 120-second cycle) are shown in Exhibit 5-15:
We can also perform a signalized intersection analysis using projected traffic under the same actuated control parameters. A similar comparison between TWSC and signal control for future conditions is presented in Exhibit 5-16:
The results here show the delay changed from the stop controlled approaches to the eastbound left turn and the southbound right turn, because of the significant demand on these approaches result in delays even with a traffic signal at this location. |
||||||||||||||||||||||||||||||||||||||||||||||||||||||||||||||||||||||||||||||||||||||||||||||||||||||||||||||||||||||||||||||||||||||||||||||||||||||||||||||||||||||||||||||||||||||||||||||||||||||||||||||||||||||||||||||||||||||||||
Page Break
Sub-problem 1b: Analysis of the Signalized Intersection with Projected Traffic How can the delay at an unsignalized intersection be compared with that at a signal? These findings confirm the obvious, which is that a signal imposes delay on the major street through and right-turn movements, which would not have experienced these delays if the intersection were to remain under two-way stop control. The findings go beyond this to quantify the amount of delay likely to be experienced by these major street movements. This is an important consideration, since these are also the highest-volume movements at the intersection. On the other hand, delays are reduced substantially for all minor street movements. So, which case really represents the better control strategy, in terms of minimizing delay, for the overall intersection? To better understand whether this is really an improvement to the operation of the intersection, at least as defined by levels of delay, we must realize that these delay values are expressed in terms of the average number of seconds of delay per vehicle. So, for comparison purposes, it is important to apply these estimates to the number of vehicles affected for each movement. To accomplish this, we can compute the total delay, in seconds, incurred by all entering vehicles. This requires that we multiply the computed average delays for each movement by the number of vehicles in each movement, and that we perform this calculation for both the signalized and TWSC intersection scenarios. This comparison is illustrated below:
As you can see, for existing geometry and projected traffic, the intersection actually performs better (less delay) under signalized control than under TWSC control. Since the delays were very large on the minor street movements under TWSC, values of 999 seconds per vehicle were assumed (the delay equation actually predicts even larger values than this). Even with this assumption, the delays on the minor street are reduced significantly with signal control. The delays do increase for the major street movements under signal control but are far outweighed by the improvements on the minor street approaches. It should be noted that normally for undersaturated conditions, the benefit of zero delay for the major street throughs and rights would outweigh the benefit to side street traffic in this comparison. However, the very long delays estimated for the side street movements under TWSC control are what determined the outcome of this comparison. |
||||||||||||||||||||||||||||||||||||||||||||||||||||||||||||||||||||||||||||||||||||||||||||||||||||||||||||||||||||||
Page Break
Sub-problem 1c: Analysis of the Signal with Pedestrians and Bicycles Step 1: Setup As we noted in the TWSC portion of our analysis, pedestrians can have a significant effect on delay. We can see how pedestrians (and bicycles assumed at 10% of pedestrians) affect our signalized intersection by analyzing conditions both with and without taking account of the pedestrians and bikes; the results of this analysis are presented in Exhibit 5-18.
It is obvious from this analysis that the effects of pedestrians and bicycles on the intersection are significant, almost doubling queues for the southbound right turns and increasing the delay by about 35% (106 sec/veh to 162 sec/veh) across the overall intersection. This occurs due to adjustments to the saturation flow rates to account for the effects of pedestrians and bicycles on the conflicting vehicular movements; this is a relatively new adjustment to the HCM operational analysis procedure, having been introduced in Chapter 16, Appendix D of HCM2000. For this particular analysis, the resulting adjustments are important to take into account, especially for the southbound right turns where the flow rate was reduced by 40%; but all movements had adjustment factors lower than 1.00. With this level of effect on flow rate, and subsequently capacity and delay, strategies to reduce this effect would be reasonable to pursue. |
||||||||||||||||||||||||||||||||||||||||||||||||||||||||||||||||||||||||||||||||||||||||||||||||||||||||||||||||||||||||||||||||||||||||||||||||
Page Break
Sub-problem 1c: Analysis of the Signal with Pedestrians and Bicycles Testing an alternative that requires pedestrians to cross on only two of the four approaches might make sense here. Strategically, this can be orchestrated to benefit the right turns that need it most. From a practical viewpoint, we know the predominant pedestrian flow is from the southwest (student parking) to the northeast (classes) and the reverse. Because the right turns are by far the heaviest for the southbound and westbound vehicular movements, we can consider closing the crosswalks on the western and northern legs of the intersection. Of course, this would mean that the pedestrian and bicycle flow rates for the closed crosswalks would have to be added to those left open. Additionally, we should not forget that such an action would detract from overall pedestrian accessibility and mobility, which may also be an important consideration in and of itself. Thus, other factors besides the vehicular operating characteristics of the intersection should also be considered, and in some cases may have a direct bearing on the feasibility of the various solution alternatives we would otherwise consider. Discussion: |
Page Break
Sub-problem 1c: Analysis of the Signal with Pedestrians and Bicycles Step 2: Results Under the presumption that the pedestrian crossings on the western and northern legs of the intersection are closed, then the HCM signalized intersection analysis procedure yields the results shown in Exhibit 5-19.
These results show that closing the crosswalks on the western and northern legs of the intersection improves the right-turn movement operations for two approaches and increases the delay for those where the pedestrians and bicycles are consolidated. This is reasonable, and confirms what we would have expected. These benefits come from the adjustments to the right-turn movement saturation flow rates. It appears that the benefit to the eastbound and southbound approaches outweighs delay added to the westbound and northbound approaches. This was expected (and by design), since the major right-turn traffic is eastbound and southbound. |
||||||||||||||||||||||||||||||||||||||||||||||||||||||||||||||||||||||||||||||||||||||||||||||||||||||||||||||||||||||||||||||||||||||||||||||||
Page Break
Sub-problem 1c: Analysis of the Signal with Pedestrians and Bicycles It might also be possible to convert this four-legged intersection into a T-intersection, recognizing that there would be fewer conflicting movements and fewer signal phases. In this particular case, the possibility exists to close the northbound approach. This will allow two exclusive right-turn lanes on the southbound approach within the proposed right of way, since no through movement is now needed. Closing the northbound approach is something the University has been considering for some time, and this would have the additional benefit of removing some of the current conflicts between vehicles and pedestrians/bikes. The results of an HCM analysis with this new lane configuration are presented in Exhibit 5-20.
The results of the analysis show that this reconfiguration of the intersection results in significant improvement in the operation of the intersection. Overall delays are reduced from 110 sec/veh (LOS F) to 53 sec/veh (LOS D). |
||||||||||||||||||||||||||||||||||||||||||||||||||||||||||||||||||||||||||||||||||||||||||||||||||||||||||||||||||||||||||||||||||||||||||||||||
Page Break
Sub-problem 1c: Analysis of the Signal with Pedestrians and Bicycles Now that we have been able to optimize the operation of the intersection through the introduction of a traffic signal and reconfiguration to a three-legged form, let's revisit the comparison with a do-nothing approach, which would retain the current stop control on the minor approaches. A comparative summary of these analysis results, based on HCM prescribed procedures, is presented in Exhibit 5-21.
In this case, the difference from do-nothing that is achieved through both operational and geometric modifications is fairly dramatic: in terms of average delay experienced by approaching traffic, the revised intersection results in nearly a 90% reduction in total delay when compared to the current geometric configuration and reliance upon stop control. Note that both the signalized and TWSC procedures assume adequate left-turn and through movement storage when computing delay. This means that these procedures do not account for the effects of left-turn queues, that might exceed the provided storage and interfere with the through movements, on delay computations. The procedure is also treating the intersection as isolated and will not account for delay effects resulting from through movement queues that could spill back into adjacent intersections. To investigate this issue further, we would need to go beyond the current HCM procedures to employ macroscopic and/or microscopic simulation. |
||||||||||||||||||||||||||||||||||||||||||||||||||||||||||||||||||||||||||||||||||||||||||||||||||||||||||||||||||||||