|
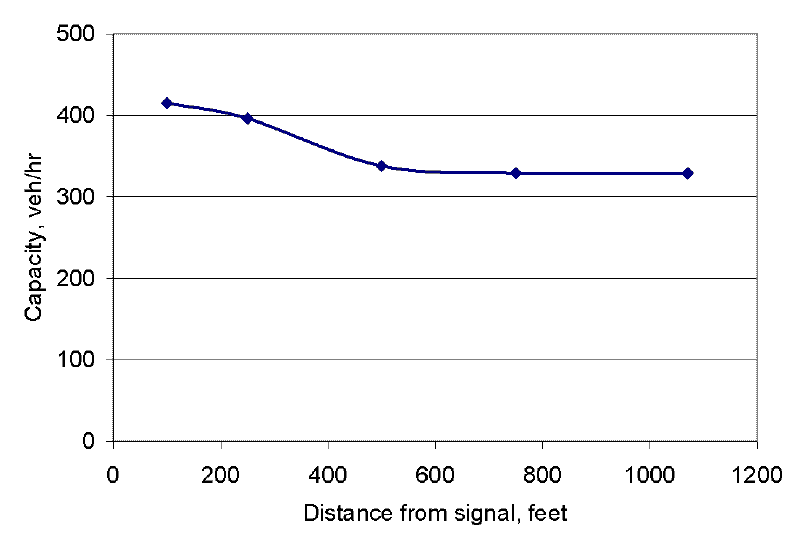
The graphic below shows a plot of capacity vs. distance downstream from a signalized intersection for the conditions given in sub-problem 2a. We assumed for this problem that, for the upstream signalized intersection, the cycle length was xx seconds and the green time was xx seconds. |
|
|
