Problem 2: Moe Road
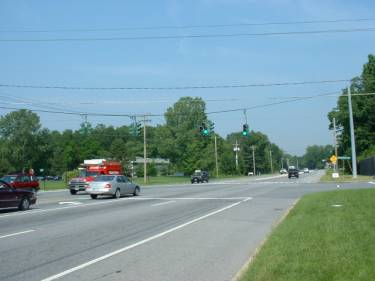
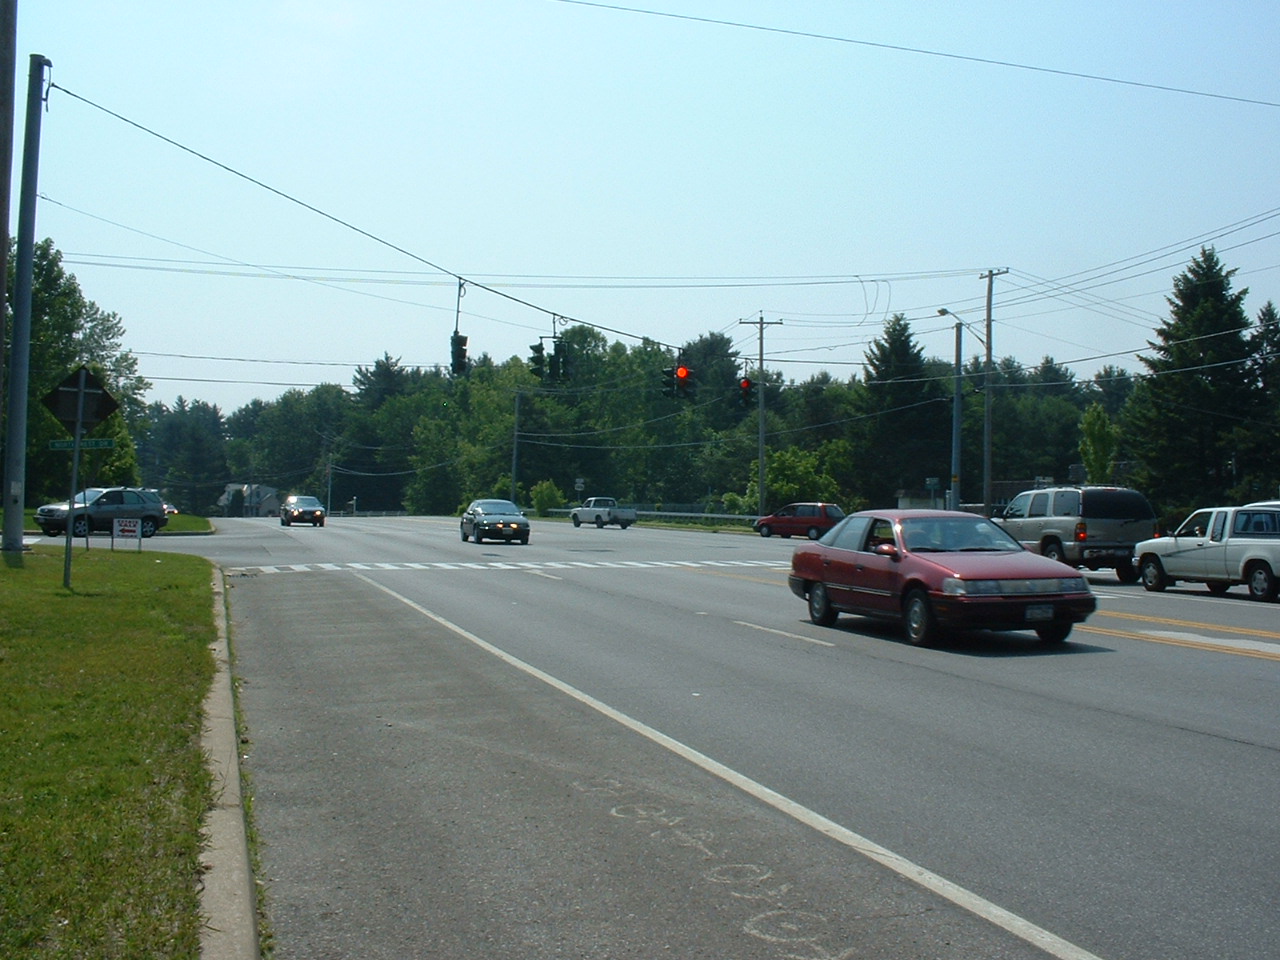
The intersection of Moe Road with Route 146 (Intersection B) is signalized and fully actuated. A picture of the site, taken from the perspective of the westbound approach, is shown in Exhibit 2-20. The lane configuration is depicted in Exhibit 2-21. The eastbound and westbound approaches are both three lanes wide (left, through, and through/right). The eastbound approach is shown here. A second picture of the westbound approach is shown here.
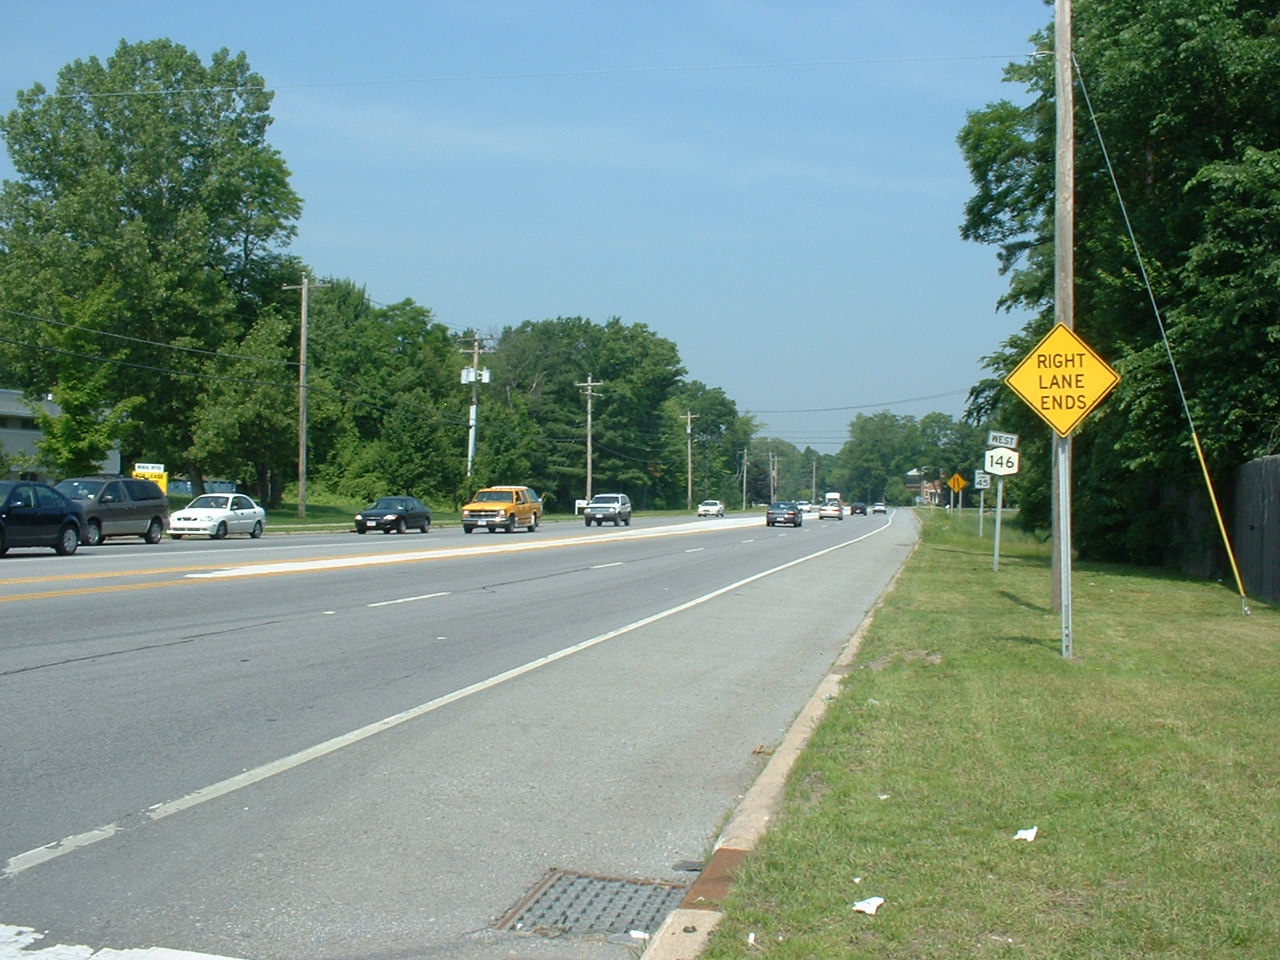
On the eastbound approach, the through lanes (through and through/right) continue east, while the westbound lanes taper to a single lane. You can see the taper in the distance in the photograph. Click here to see a close-up. The northbound and southbound approaches are both one lane wide (left/ through/right). The northbound approach is shown here and the southbound approach is shown here.
The eastbound traffic arrives in platoons, discharged from the upstream intersection at the entrance to the Shenendehowa campus. (see Problem 3.) The westbound traffic also arrives in platoons, discharged by the Maxwell Drive intersection (see Problem 1). The distance to these intersections is such that the signals tend to synchronize antagonistically. That means the platoons tend to arrive on red. As a result, we’ve assumed arrival type 2 for both approaches. The north and southbound traffic arrives randomly, so we’ve assumed arrival type 3. Another intersection less than a mile to the south provides access to the Shenendehowa main campus; but most of the time, the signal is green north-south, since the only traffic on the side street is going to and from school parking lots. |
Page Break
| Photograph of the eastbound approach at Moe Road |
 |
Page Break
| Photograph of the westbound approach at Moe Road |
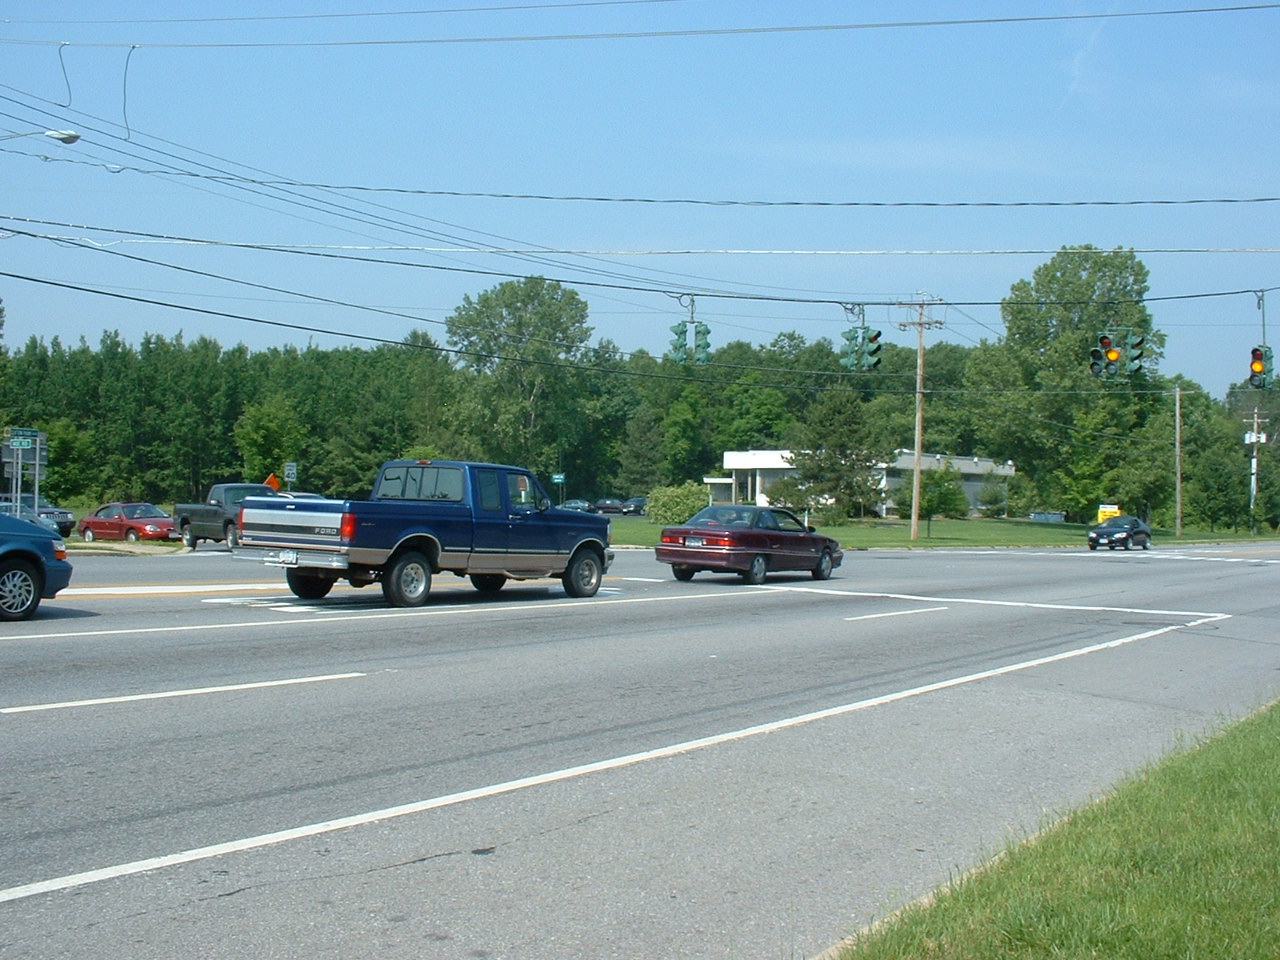 |
Page Break
| Photograph of the westbound receiving lanes at Moe Road |
 |
Page Break
| Photograph of the northbound approach at Moe Road |
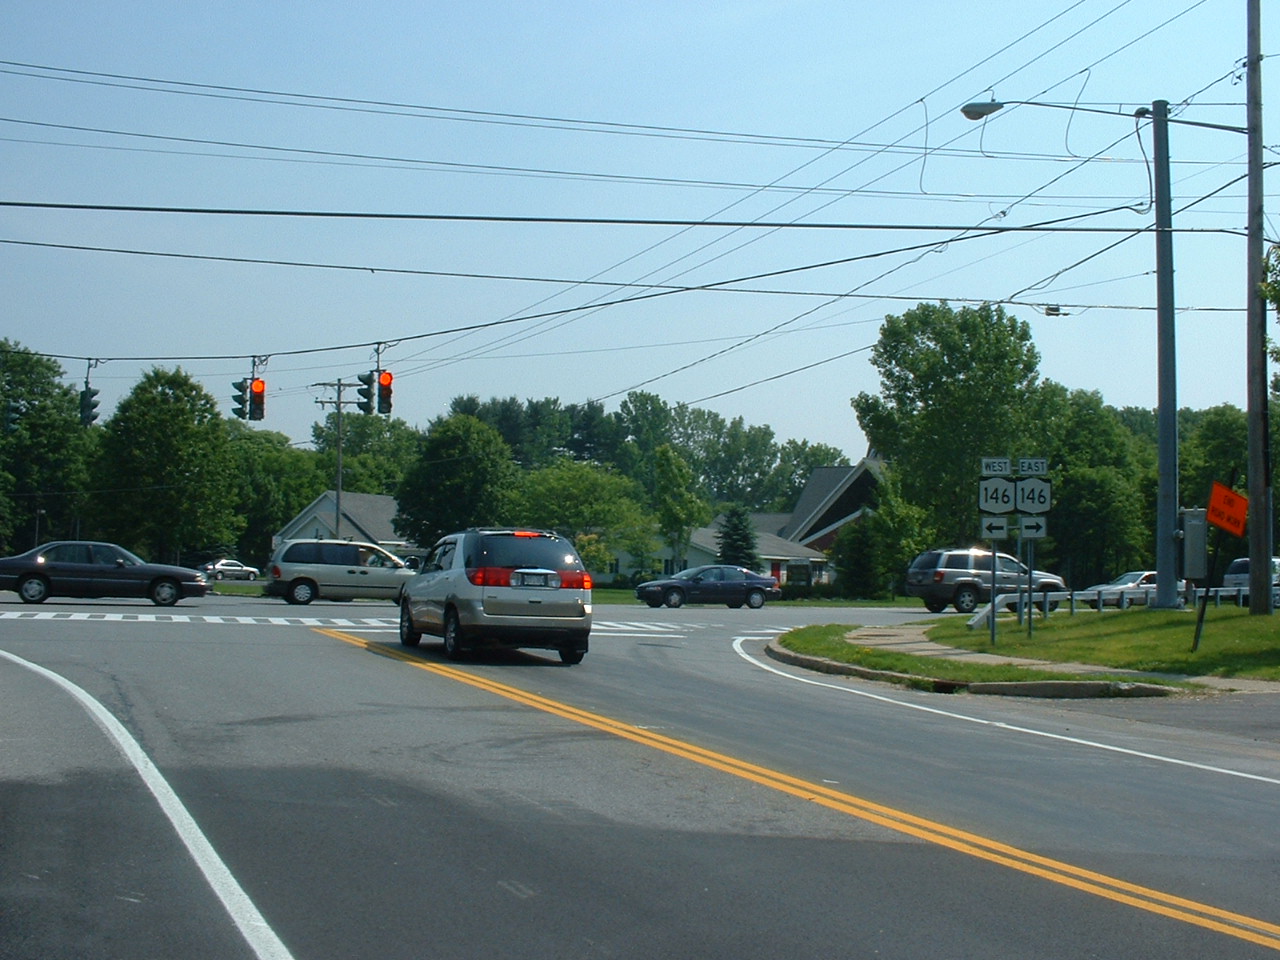 |
Page Break
| Photograph of the southbound approach at Moe Road |
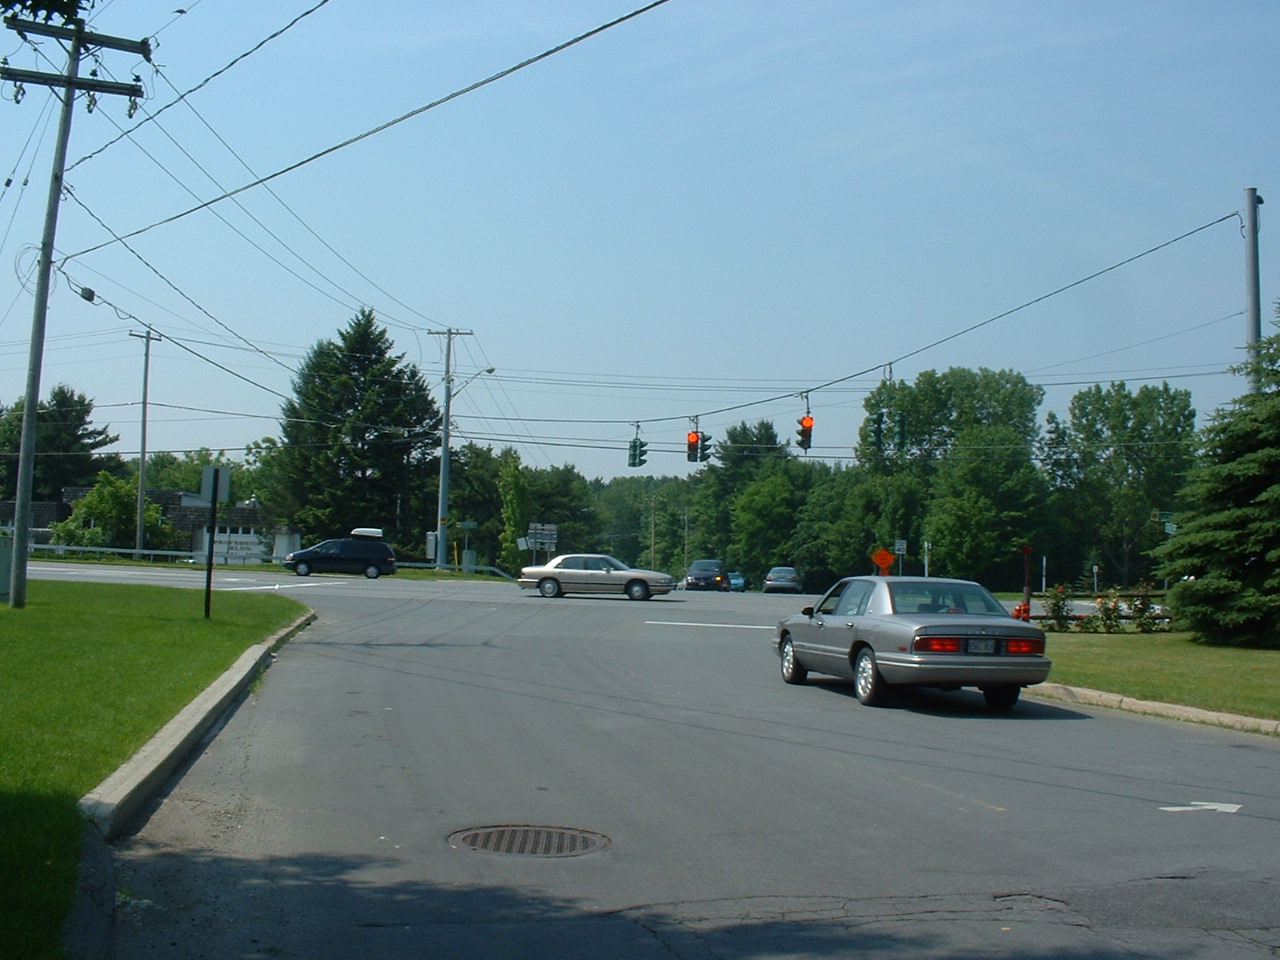 |
Page Break
Problem 2: Moe Road The signal phasing is shown in Exhibit 2-22. There are three phases: 1) westbound protected left; 2) east-west green with permitted lefts; and 3) north-south green with permitted lefts.
Exhibit 2-23
|
|||||||||||||||||||||||||||||||||||||||||||||||
Page Break
Problem 2: Moe Road Analysis Plans
Discussion: |
Page Break
Sub-problem 2a: Moe Road AM peak hour - Existing Conditions
Pedestrians We will start our analysis with the signal timings. To cross the intersection, regardless of direction, the pedestrians always need two to three times as much time as the vehicles do. In fact, the pedestrian times tend to be distributed exactly opposite to the vehicle times. For the vehicles, the largest green time is usually needed for the main street and much less time is needed for the side street. It’s the other way around for pedestrians, where the street widths dictate the green times, not the pedestrian volumes. Most often, the street that’s widest to cross is the main street. And since the pedestrians cross the main street concurrent with the side street throughs-and-rights, the side street green time is boosted considerably. Similarly, the pedestrian times for the main street are much shorter than the vehicular times because the width of the side street is typically less. In an intersection where vehicular greens are 30 seconds for the main street and 10 seconds for the side street, pedestrian timings need to be quite different. The pedestrian greens might be 20 seconds for the main street (7 seconds of walk plus 13 seconds of flashing don’t walk, based on a 40-foot wide street) and 28 seconds for the side street (7 seconds of walk plus 21 seconds of flashing don’t walk, based on a 70-foot wide street). In this situation, the usual solution is to boost the vehicular signal timings so that 1) the 24-second minimum for the side street is met, and 2) the 30:10 ratio for the vehicular times still pertains. Thus, the main street green would have to be 72 seconds to satisfy the 30:10 ratio, given the 24-second green on the side street. Assuming 4 seconds for the yellow and all red, the 48-second cycle without the pedestrians (30+4+10+4) becomes a 104-second cycle with pedestrians (72+4+24+4). At Moe Road, pedestrians are important during the AM Peak hour. Students cross Route 146 going south on their way to school. Consequently, for an AM peak hour analysis, we have to take into account the pedestrians on the north-south phase. Discussion: |
Page Break
Sub-problem 2a: Moe Road AM peak hour - Existing Conditions Exhibit 2-24 presents three model runs that focused on the AM Existing peak hour. Here you can view the input data for the base case (Dataset 15), maximum pedestrians (Dataset 16), and no pedestrians (Dataset 17) conditions.
In the base case, with pedestrians included, the cycle length is 72 seconds and the delays are between 12.6 and 25.6 seconds per vehicle (dataset 15). Interestingly, even if you boost the southbound pedestrians to the maximum limit allowed by the HCM methodology (1,700 pedestrians per hour), the delays change very little. The southbound delay increases from 19.5 seconds per vehicle to 19.6 and the northbound delay increases from 22.8 to 23.6 (dataset 16). So in this instance, the interference between the pedestrians and the vehicular traffic is not significant. The more significant story relates to what the situation would be without pedestrians. As the third run shows, the delays would drop to 12.2 seconds per vehicle overall, 33% less than the base case. The delays by movement drop from a range of 12.6-25.6 seconds per vehicle to 7.4-16.5 seconds per vehicle (dataset 17). That’s as much as a 35% difference. This happens because we can now use phase times that don’t meet the pedestrian minimums. Instead of using 8, 33, and 21 seconds for phases 1, 2, and 3 (to meet the 21-second minimum for phase 2, given the pedestrians), we can use 3, 20, and 11. What is learned from this? If pedestrians are present, make sure you account for them when you analyze the intersection. Most importantly, make sure you use green times that meet or exceed the pedestrian requirements. |
||||||||||||||||||||||||||||||||||||||||||||||||||||||||||||||||||||||||||||||||||||||||||||||||||||||||||||||||||||||||||||||||
Page Break
Sub-problem 2b: Moe Road PM peak hour - With Conditions
Lane
Utilization At the Moe Road intersection, this situation exists for the westbound approach. The two lanes merge into one about 250 feet downstream of the intersection (click here to see a photo). The right-hand lane ends and its traffic must merge left. This creates a tendency for drivers to use the innermost lane, especially when the flows are light to moderate. The day we collected data, 57% of the westbound traffic was in the inner lane. At other times, that number can be as high as 75%. From an HCM perspective, the lane utilization factor, fLU, is defined as the ratio of the average volume per lane to the volume in the heaviest-used lane. Therefore, if the total volume is 1,000 vehicles per hour and there are two lanes, the average volume per lane is 500 vph. If the heaviest-used lane sees 750 vehicles per hour, the lane utilization coefficient is 0.67 = 500/750. If the lane utilizations are given in percents, the lane utilization coefficient is given by the ratio of the average percentage of traffic per lane, in this case 50% divided by the maximum percentage per lane, or 75%. The day we collected data, 57% of the westbound traffic was in the inner lane, so the lane utilization coefficient on that day was 0.81 = 50%/57%. We used this value in all the analyses. At other times, we indicated that the percentage of traffic in the inner lane can reach as high as 75%. We’re going to use that value for comparison purposes. Discussion: |
Page Break
Sub-problem 2b: Moe Road PM peak hour - With Conditions In Exhibit 2-25 we show the results from four runs (Datasets 18, 19, 20, and 21). The first is a base case condition. In it, we’ve used the PM With intersection volumes along with an assumption that there are no pedestrians. We used an average cycle length that minimizes delay and balanced the delays among the approaches. The delays average 21.2 seconds per vehicle and range from 10.1 seconds to 33.5 seconds. The average queue lengths range from 0.2 to 11.1 vehicles and the 95th-percentile queues are double that.
The second run looks at the effects of uncertainty. What happens if the site generated traffic is 30% more than predicted. We see that the average delay increases slightly from 21.2 to 23.9 seconds. The three critical moves (as can be seen from the base case) are the eastbound through, the westbound left, and the northbound approach. These have the highest delays. In the second run, we see that two of these moves have major changes in delay: the eastbound through sees an increase from 23.8 to 28.2 seconds and the northbound approach sees a change from 31.9 to 36.4 seconds. |
||||||||||||||||||||||||||||||||||||||||||||||||||||||||||||||||||||||||||||||||||||||||||||||||||||||||||||||||||||||||||||||||||||||||||||||||||||||||||||||||||||||||||||||||||||||||||||||||||||||||||||||||||||||||||||||||||||||||||||||||||||||||||||||||||||||||||||||||||||||||||||||||||||||
Page Break
Sub-problem 2b: Moe Road PM peak hour - With Conditions What if you had forgotten to take account of the lane utilization factor? What would happen if you didn’t enter the correct values of 0.81 for the westbound throughs and 0.88 for the eastbound throughs? What results would you get in the second run? As the third run shows in Exhibit 2-25, the average delay would have been 20.1 seconds instead of 23.9; the eastbound through would have shown a delay of 21.4 seconds instead of 28.2. That’s a difference of 25%. The westbound through would have shown a delay of 11.7 seconds instead of 14.7, which is a difference of 20%. This demonstrates the importance of using the lane utilization factor. What if the lane utilization was actually worse than what we saw on the day we observed the traffic? What would be the intersection’s performance if the westbound lane utilization were (75%, 25%) instead of (57%, 43%)? As the fourth run shows, the answer is that the westbound delay would be 29.0 seconds instead of 18.3, (58% larger) and the average delay would be 29.5 seconds instead of 23.9 (17% larger).
Discussion: |
Page Break
Problem 2: Moe Road
Discussion In the case of pedestrians, we’ve learned a little about how pedestrian timings are defined: an initial walk time plus an increment of flashing don’t walk time that allows a person to walk across the street. We’ve learned that these pedestrian timings are often in conflict with the vehicular timings in that the longer pedestrian timings tend to be associated with the side street, which typically has the shorter vehicular green. We’ve seen that to allow for these pedestrian times, the cycle length gets longer and the vehicular delays get larger. Or to put it another way, if the pedestrians weren’t present, the cycle length could be shorter and the vehicular delays smaller. pedestrian push-buttons are particularly valuable where the pedestrian volumes are light. When pedestrian timings aren’t needed (that is, when the controller does not receive a call for pedestrian service), the vehicular-based timings can be used. That means that on those cycles when the pedestrian timings aren’t invoked, the delays will be shorter and the signal will be more responsive to the vehicular flows. Hence, pedestrian push buttons have great value. In the case of lane utilization, we’ve seen what effect it can have on estimates of delays and queue lengths. We’ve seen that as the lane utilization gets poorer (i.e., more traffic in just one lane), delays and queue lengths increase. Not accounting for lane utilization, and using the defaults, can lead to overly optimistic assessments of intersection performance. |