Home
> Data >
U.S. 95/Styner-Lauder Avenue
Traffic volume data were collected manually
at the intersection over a period of three days. The data in Exhibit 1-7 represent
the average values for the peak 15 minute period during the afternoon peak
period.
The data for the existing and projected
ten-year traffic volumes are given in the tables below.
|
Exhibit 1-7. Existing traffic volumes,
U.S. 95/Styner-Lauder Avenue |
| Approach |
LT (veh/hr) |
TH (veh/hr) |
RT (veh/hr) |
| Eastbound |
50 |
75 |
80 |
| Westbound |
55 |
80 |
125 |
| Northbound |
31 |
357 |
50 |
| Southbound |
59 |
392 |
165 |
Projections were made for a ten year
horizon, assuming that the existing 2 percent per year growth continues. The results of these projections are given in
Exhibit 1-8.
|
Exhibit 1-8. Projected ten-year traffic volumes,
U.S. 95/Styner-Lauder Avenue |
| Approach |
LT (veh/hr) |
TH (veh/hr) |
RT (veh/hr) |
| Eastbound |
61 |
91 |
98 |
| Westbound |
67 |
98 |
152 |
| Northbound |
38 |
435 |
61 |
| Southbound |
72 |
478 |
201 |
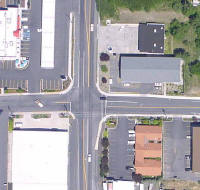
The figures below show the existing U.S. 95/Styner-Lauder
Avenue intersection geometry.
[ Back ] to Getting
Started
[ Continue ] with Data