|
Problem 3: Signal Timing Analysis of Rietz Union Drive/Museum Road In Problem 2 we explored signalization of the Rietz Union Drive/Museum Road intersection with development of the parking garage, including various phasing plans and cycle length mitigations to reduce both vehicular and pedestrian delay. Several assumptions were made regarding the signal timing parameters at the intersection which simplified our analysis. In this sub-problem, we will further explore those assumptions and the effect that changes to these parameters have on the intersection performance. We will also explore the extent that a local jurisdiction's operational requirements have on the actual performance of an intersection. In this instance, we will explore the effect of various signal timing parameters on volume to capacity ratio and how this relates to signal timing within the signal controller. In this problem, consider the following issues as you work through the computations for the three sub-problems:
This problem illustrates some of the important elements regarding the differences between HCM operations analysis methodologies and results and field operations. The problem is separated into three sub-problems: Sub-problem 3a: Actuated Signal Detection and Signal
Timing Discussion:
[ Back ] to Getting Started [ Continue ] to Sub-problem 3a |
Page Break
|
Sub-problem 3a: Actuated Signal Detection and Signal Timing Step 1. Setup In sub-problem 3a, we will evaluate the operational characteristics of the signalized intersection and how the coordinated signal timing parameters affect operations in the field, considering the effect of various volume to capacity ratios on performance. Before we look at the volume to capacity ratios, we will first discuss how actuated signals interact with detectors to determine phase lengths. As mentioned in previous sub-problems, there are three basic types of signal control: actuated, semi-actuated, and pretimed. In this sub-problem we will explore actuated signal control in coordination as it relates to the Reitz Union Drive/Museum Road intersection. Because Museum Road is a coordinated corridor, a fixed cycle length is required to maintain corridor progression. In Problem 2 we assumed the cycle length for the corridor was 120 seconds and that each approach was phased permitted. In this sub-problem, we will explore how this assumed cycle length is broken into phase lengths. Not only will we look at the average for the hour, but we will also look at how individual cycle lengths vary throughout the hour. Discussion: |
Page Break
|
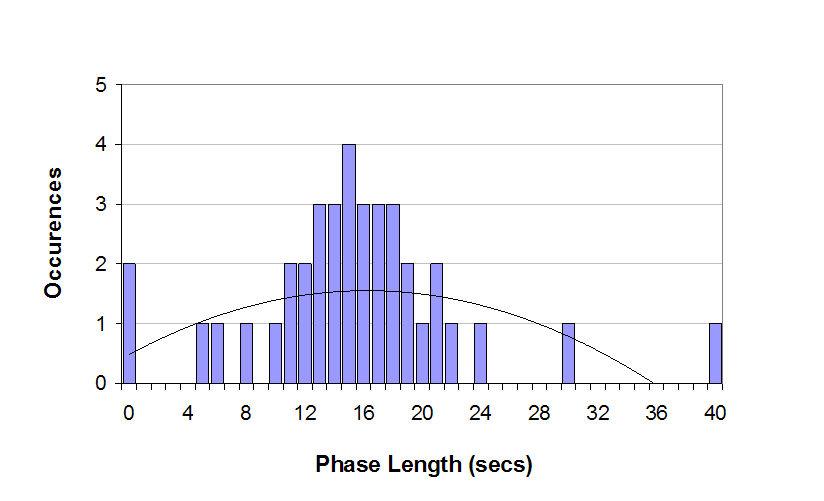
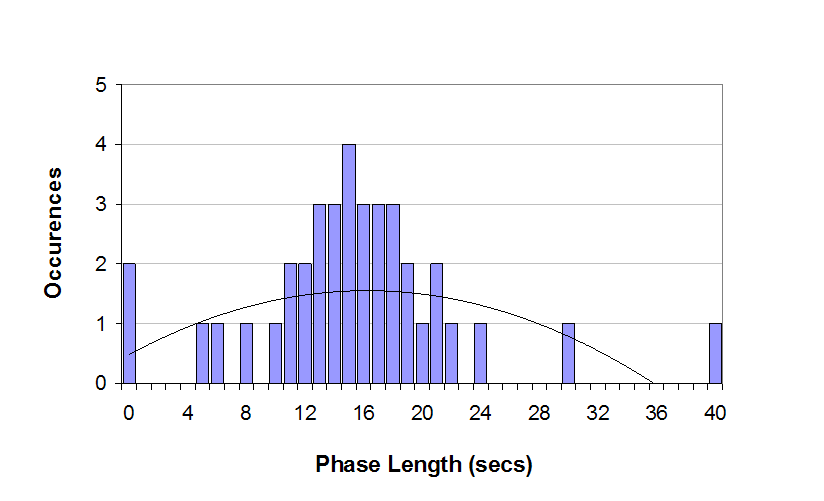
Sub-problem 3a: Actuated Signal Detection and Signal Timing Let's discuss each of the questions posed on the last page. Why would a corridor with progression need to maintain a fixed cycle length? A fixed cycle length is frequently used to maintain coordination between adjacent intersections where the traffic engineer seeks to preserve the quality of progression. The arrival type is the primary input to the methodology that affects this calculation. A cycle length is imposed upon an intersection by assigning a coordinated movement or group of movements to the intersection. This is typically the main street through phase. Once this is established, other phases at the intersection are actuated, meaning that the time allotted to each of these phases is dependent upon the signal timing parameters and demand, or as the HCM states: these phases "can be extended by reassigning unused green time from actuated phases with low demand." In our case, Museum Road is the coordinated movement and Reitz Union is actuated. Thus, if Reitz Union does not have any demand during a cycle, Museum Road will stay green throughout the cycle. Essentially, whatever time is unused on Reitz Union is received by Museum Road because the traffic controller will maintain progression by giving remaining green to the coordinated phase. What is the difference between looking at an average hourly cycle versus individual cycles? The difference between looking at average phase lengths and phase lengths throughout the hour depends on the variability of traffic volumes. Volumes vary cycle by cycle throughout the hour. Exhibit 5-X shows the phase length versus the number of occurrences.
What should be noted from this figure is that throughout the hour the phase length varies as arrivals vary. The Museum Road phase length would show an inverse relationship due to the effects of coordination within the controller, since it receives the additional time. In other words, in the cases where the phase length is 45 seconds for Reitz Union (40 seconds of green time), Museum Road is 70 seconds of green, and when Reitz Union is 20 seconds long, Museum Road is 90 seconds. Before we can answer this, we will take a closer look at the signal timing parameters. |
Page Break
 |
Page Break
|
Sub-problem 3a: Actuated Signal Detection and Signal Timing How do signal timing parameters affect the phase length? As we have seen from the previous page, the green time for individual phases with actuated control is variable. The time assigned to each phase is governed by three parameters, the minimum green setting, the maximum green setting, and the unit extension, also known as the passage gap.
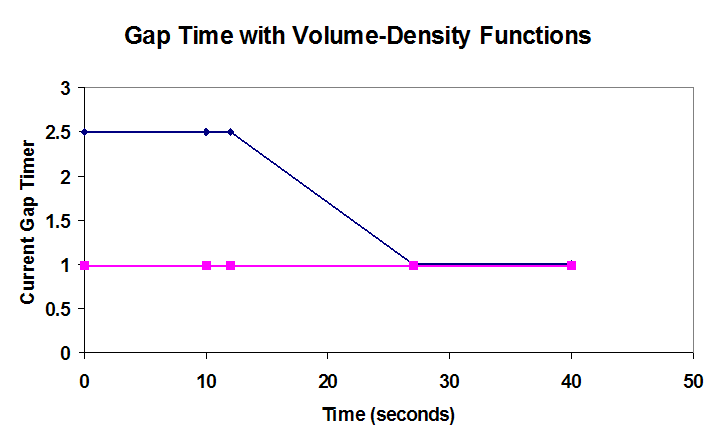
The time allotted to each phase is dependent on the demand at the intersection and these signal timing parameters. In the case where demand is light, the remaining time from each phase is reallocated to the coordinated phase. Pedestrians also have an influence on phase lengths, but for simplicity, within this first sub-problem we will ignore pedestrian effects. Two other factors may change the passage gap of a phase: TBR, or time before reduction, and TTR, time to reduce the passage gap as the phase extends past the initial value of unit extension time. These factors help to catch the platoon as it moves along a corridor. The TBR defines the amount of time the unit extension is held steady at its higher initial value. After the TBR, the unit extension is reduced, since at this point the queue that was waiting for the light is moving at a steady speed across the detectors. The unit extension value is reduced in a linear manner to the minimum gap time. The time that passes from the TBR to when the unit extension is at the minimum gap time is the TTR. Exhibit 5-X below demonstrates this concept, with an inital passage gap of 2.5 s, a minimum gap of 1.0s, a TBR of 12s, and a TBR of 15s.
On the next page, we will apply this information to our example. |
Page Break
|
Sub-problem 3a: Actuated Signal Detection and Signal Timing If we look back at the analysis completed in Sub-problem 1b, page2, we assumed the default value of unit extension (3.0 seconds) and a g/c ratio of 0.33 for Reitz Union. However, from the discussion on the last two pages, we found that the phase length varies as a function of the signal timing parameters and thus, depending on the parameters the g/c ratio, may change accordingly. Essentially, the phase length is a function of the unit extension; once traffic is served, the controller times the gap setting as extra time looking for an additional vehicle to cross the detector. Step 2. Results How do signal timing parameters affect the phase length and the volume to capacity ratio in the HCM methodology? Let's assume our minimum green time is 5 seconds, our maximum green time is 40 seconds (as was used in the HCS analysis from Sub-problem 1b, page2), and our unit extension is three seconds. If we reduce the unit extension, we would expect the actuated side street movement (Reitz Union) to receive less green time. HCS calculates that a shorter unit extension reduces the delay for the entire intersection because there is potentially less time wasted at the intersections. If we make this change in our HCS file, now assuming that the unit extension is one second, (because we have detection on the north and south approaches that allows shorter unit extension time) (Reitz3a4 - ask PJK) we find that changing the unit extension does not change the g/c ratio assumed in the analysis for the north/south approach. This is due to the procedures within HCS represent analyses of fixed lengths of intervals and sequences of phases. In other words, there is no direct link between the g/c ratio assumed and signal timing parameters such as unit extension. The reduced unit extension does result in a reduction in delay for the intersection and each individual movement in the calculation. Is this representative of what happens in the field? This may not be representative of what occurs in the field and for a detailed analysis, measured green time for each approach may be used to refine the analysis. Reducing the unit extension would reduce the g/c ratio for the north/south movement. The coordinated phase, Museum Road through (east/west) would receive the additional time that is unused from the Reitz Union approaches. Report results from analysis here... Discussion: |
Page Break
|
Sub-problem 3a: Actuated Signal Detection and Signal Timing Unlike with unsignalized intersections, the volume to capacity ratio for a signalized intersection will vary depending on the signal timing parameters. If an intersection approach operates over-capacity, adjustments in the green allocation could be made to alter the operational characteristics of the approach. As previously mentioned, Museum Road will be coordinated with development of the signal at Reitz Union Drive. This will be necessary not only to decrease corridor delay, but, due to their close spacing, also to prevent queues from extending through adjacent intersections. Because we have a fixed cycle length, the intersection will operate as if it were semi-actuated, with additional time from the minor street phases reassigned to the major through street phases. The jurisdiction may also require the intersection operate at a Level of Service "E" or better, asking that a volume to capacity ratio less than 0.80 be maintained. What does it mean for the minor street approach to operate at a v/c ratio of 0.80? On Reitz Union, we will assume that the queue accumulates during the red time, and that once the phase is green, saturated flow will occur on the through movement. During each phase, the volume to capacity ratio is 1.0 as long as saturation flow is achieved and maintained. As the green per cycle ratio is increased for an intersection, the v/c ratio is reduced assuming all other things being equal. Thus, as time is provided to a particular movement that is unutilized, the volume to capacity ratio is reduced. As an example, let's assume we had sixteen vehicles in queue at the start of the green phase and based on our saturation flow rate we assume the intersection would need 30 seconds for queue clearance. Once the phase gapped out 3 seconds later at 33 seconds, (due to a 3 second unit extension), the approach would be operating at a v/c ratio of 0.91, adding 3 seconds of wasted delay to conflicting movements. If we were to maintain a v/c ratio of 0.8 at this approach, this phase would be 30/0.8 seconds, or 37.5 seconds. This would equate to 7.5 seconds of wasted time being added to the delay of conflicting movements. What this suggests is that there is a difference between the volume to capacity ratio reported for planning purposes and the way these intersections operate in the field. Analyses that require a future year volume to capacity ratio of 0.80 may suggest a planning method that is insensitive to detector operations being used. Discussion: |
Page Break
|
Sub-problem 3b: Pedestrian Level of Service Step 1. Setup Throughout this case study we have looked at pedestrian and vehicular mitigations at the Reitz Union Drive/Museum Road intersection. In this sub-problem, we will estimate pedestrian delay at the intersection and look at the interaction between vehicles and pedestrians. In addition, we will explore some of the factors that must be considered when analyzing pedestrian delay. Discussion: |
Page Break
|
Sub-problem 3b: Pedestrian Level of Service Step 2. Results There are two primary factors related to pedestrian delay at a signalized intersection: cycle length and effective green time for pedestrians. Intuitively, longer cycle length and less effective green time for pedestrians results in higher pedestrian delay. In addition, factors such as the effective sidewalk width and available storage area at each corner may also affect pedestrian delay. Near the university, where pedestrian volumes are high, consideration should be given to reducing cycle times, possibly by looking at double-cycle options as we explored in Problem 2. Shortening the cycle time will reduce pedestrian delay, which in turn reduces pedestrian noncompliance. Using HCM Equation 18-5 and our proposed signal timing in Sub-problem 2c, the average eastbound pedestrian delay is just over X seconds, which suggests a pedestrian LOS X with low likelihood of pedestrian non-compliance. Because this signal phasing uses an exclusive pedestrian phase, the delay for northbound/southbound pedestrians is the same for eastbound/westbound pedestrians. Discussion: |
Page Break
|
Sub-problem 3b: Pedestrian Level of Service In pedestrian delay calculations, how do you arrive at the effective green time for pedestrians? In general, you would use the effective green time for the concurrent traffic movement minus the flashing don't walk time. The effective green time wouldn't be the average effective green time, as we would want to consider only those phases where there was a pedestrian call. Why? Minor street green allocation is less than that for the major street. When a pedestrian call is present, additional green time needs to be assigned to the minor street approach to accommodate pedestrians' longer crossing time across the wider, major roadway. If we were to use an average phase time, we would include phases where no pedestrian call was present, thereby reporting a lower minor street effective green time. When we calculate pedestrian delay, we assume that pedestrian compliance is 100%. This means that a pedestrian arriving at the start of the flashing don't walk will wait until the next cycle, and a pedestrian waiting while no conflicting traffic is present will also wait. However, we also assume that all vehicles, especially in regards to channelized right-turn on reds, obey the right-of-way and yield to pedestrians. Pedestrian characteristics may also affect pedestrian delay. At an intersection of two major roadways, a pedestrian that hits both push-buttons may have to longer than if they were to hit the correct one. Further complicating the analysis, some high-volume roadway intersections expect pedestrians to wait at a center median before finishing their crossing. These are some of the factors that must be considered when analyzing pedestrian level of service. In most cases, the pedestrian delay equation will be a worst-case analysis scenario that gives an upper-bound to pedestrian delay. However, under certain circumstances this may not be the case. |
Page Break
|
Sub-problem 3c: Step 1. Setup Discussion: [ Back ] [ Continue ] with Sub-problem 3c |

