Overview
Krome Avenue is a 33-mile north-south route that bypasses Miami, Florida on the west side. It is essentially a rural route that has very little roadside development. Florida’s Turnpike is about 5 miles to the east, providing several east-west connections to Krome Avenue. Its two-lane configuration has limited capacity compared to other facilities such as freeways and multilane roadways. Most of the route now operates well within its capacity, except that some congestion has been observed at critical locations. This is a region of high population growth that is expected to generate continually increasing traffic volumes. Prompted primarily by safety considerations, the posted speeds have already been reduced below the 55 mph level typically found on open highways. In this case study, we will go through the process of identifying the goals, objectives and analysis tools for an investigation of the existing level of service on the entire route. We will then apply the analysis tools to assess the current performance of this route and to identify areas that are deficient. Finally, applying the same analysis tools, we will investigate some alternatives for correcting the deficiencies. The main purpose of the case study is to illustrate the concepts and practice of applying the analysis tools in general, and the Highway Capacity Manual (HCM) in particular. Much of the discussion will be based on a recently completed study of Krome Avenue that had similar goals and objectives. Several problems will be presented to illustrate the application of the tools and the interpretation of the results. |
Page Break
Overview Krome Avenue is a real highway and the data used in the problems represent actual field data. In some cases the alternative intersection improvements discussed in this case study were chosen for their illustrative value, and do not necessarily reflect the recommendations of the original study. After studying this material, you should be able to:
|
Page Break
Introduction
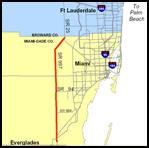
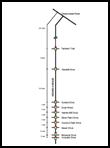
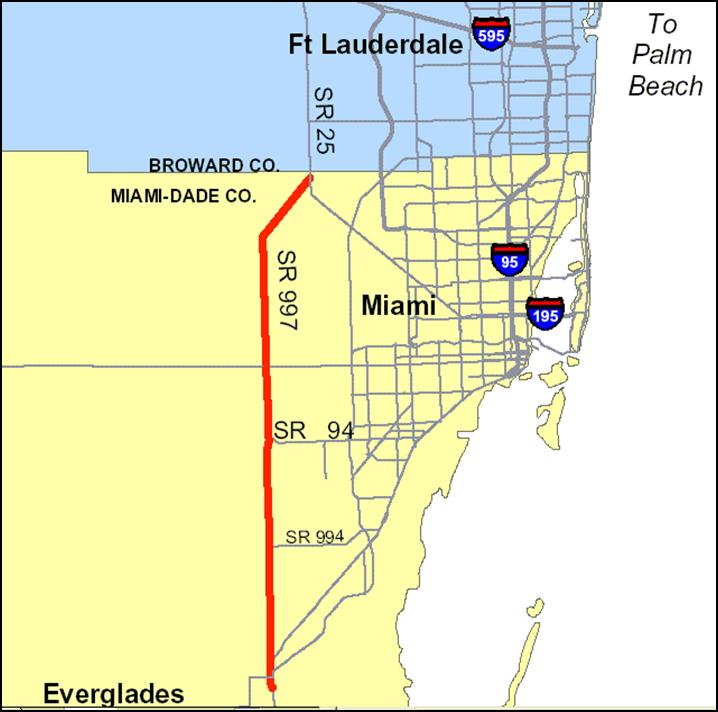
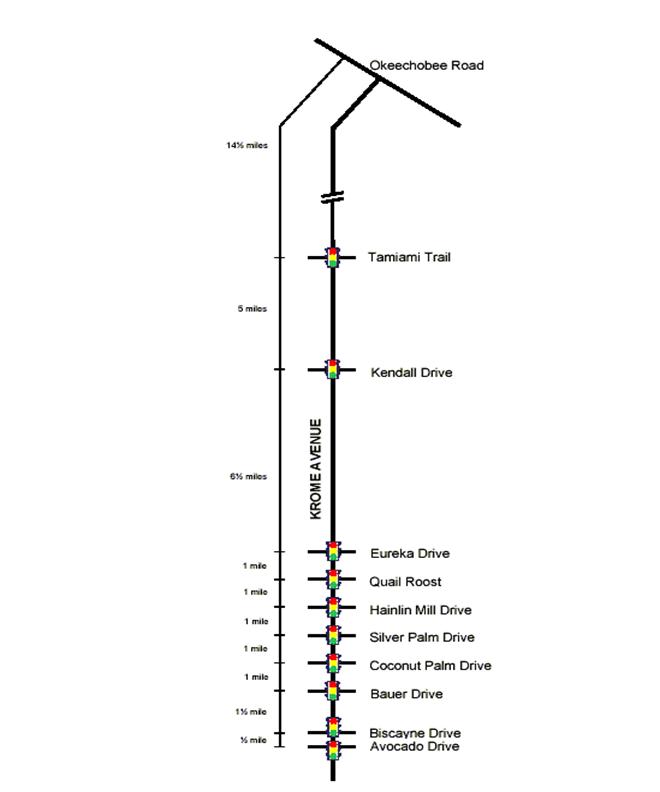
Krome Avenue (SR 997) is one of the westernmost roadways in the Miami urban area, separating the developed portion of Miami from the Everglades, as shown in the map of Exhibit 3-1. There are no access controls that would give it any of the characteristics of a freeway. Traffic volumes are moderate; and congestion is not a major problem, except at a few critical intersections with important east-west arterials. A schematic overview of the entire route is presented in Exhibit 3-2. This route has all of the characteristics of a two lane rural highway at the north end. It becomes increasingly urbanized (still retaining the two-lane configuration) and is clearly a signalized arterial at the south end of the study section. There are several intersections, both signalized and unsignalized, that require attention and analysis to determine what, if any, modifications should be made. Some of the intersections have unusual features that will be explored to create a better understanding of the application of the HCM. Discussion: |
Page Break
| Exhibit 3-1. Krome Avenue |
 |
Page Break
| Exhibit 3-2. Route Overview |
|
|
Page Break
Getting Started
To begin this particular case study, we need first need to consider issues related to setting the scope, the goals and objectives, the analysis methodology, the sequencing of the analysis, the tools to use, and the data to employ. The following series of questions must be answered before the detailed work begins:
|
Page Break
Getting Started
What are the goals, objectives, and scope? In order to meet the project goals set forth by FDOT staff, we'll need to address the following specific project objectives:
The scope of the study precludes major construction projects such as conversion of Krome Avenue from a two-lane facility to a multilane facility. Because of the simplicity inherent in rural settings, we will not go into great depth in the analysis of the intersection operations, except when a useful illustrative purpose exists. Other case studies in this Guide deal with more complex intersections in more urbanized settings. Population growth in Florida is a complex issue that will be simplified for this study by assuming fixed annual growth rates for traffic volume projections. |
Page Break
Getting Started
What tools should we
apply? What analyses should be conducted? Exhibit 3-3. Traffic Analysis Problem Classification |
|||||||||||||
|
Analytical tools |
|
HCM Part II |
|
Facility type |
HCM Part III |
|
HCM Part IV |
|
Level of analysis |
|
Problem type |
||
|
HCM |
|
10 |
|
Interrupted |
15 |
|
28 |
|
Planning |
|
Functional Design |
||
|
Macroscopic simulation |
11 |
16 |
29 |
Design |
Detailed design |
||||||||
|
Microscopic simulation |
12 |
17 |
30 |
Operational analysis |
Access management |
||||||||
|
Other tools |
13 |
Uninterrupted |
20 |
|
|
Intersection operations |
|||||||
|
|
14 |
22 |
Arterial operations |
||||||||||
|
|
23 |
Network operations |
|||||||||||
|
24 |
Freeway operations |
||||||||||||
|
25 |
Corridor study |
||||||||||||
|
|
18 |
Sub-area Study |
|||||||||||
|
19 |
Areawide study |
||||||||||||
Page Break
Getting Started Who are the
stakeholders and what are their issues? The stakeholders are united around the goal of creating a safe and operationally efficient environment, but they have different ideas about how this might be accomplished. Some think the answer to current operational and safety problems is to modernize the roadway by adding new through lanes and exclusive turn lanes, while others think that such actions would raise speeds, increase volume, and create new problems at the interface points between the urban and rural environments. Even with these preconceptions, all stakeholders recognize that it is too early in the process to be definitive about a preferred course of action, and they see this study as a necessary precursor to the development of alternative solutions, where facts are gathered and objective analyses are performed so that all future solution concepts can be judged against a common reference point. |
Page Break
Getting Started
What information is required
to support the analyses? To establish the data requirements, it is necessary to refer to each of the facility chapters to identify the important determinants of the level of service on a facility. Referring to Chapter 10 (Urban Street Concepts), we are able to learn that the information in Exhibit 3-4 is needed to determine the arterial class:
|
||||||||||||||||||||||||
Page Break
Getting Started Chapter 15 tells us that an arterial analysis is performed separately on each segment of the facility. The only piece of facility-wide data is the length of the analysis period, usually 15 minutes or one hour. A segment is usually terminated by a signalized intersection. The following information is needed for each segment to produce an estimate of the LOS for a signalized arterial:
|
||||||||||||||||||||||||||||
Page Break
Getting Started We must refer to HCM Chapters 12 and 20 to determine the information required for LOS estimation on two-lane highways. Referring to Chapter 12 (Highway Concepts), we are able to learn that the determination of the highway Class is related more to the general nature of the highway and to motorist expectations than to quantitative field data. Unlike signalized arterials, there is no segmentation involved in a two-lane highway analysis. The facility is assumed to be homogeneous, and heterogeneous segments should be analyzed as separate facilities. The following information is needed to produce an estimate of the LOS for a two-lane highway:
|
||||||||||||||||||||||||||||||||
Page Break
Getting Started
What growth rates should be
expected for future traffic volumes? The logarithmic projection is more realistic of future growth for three reasons: 1) a linear rate of traffic growth is not physically possible to sustain for an indefinite period of time, 2) the historical ADT data from 2000 and 2001 in some cases already shows a trend that is starting to level off (that is, the rate of growth is decreasing), and 3) as roadways become more congested, the rate of traffic growth decreases. In addition, the future land-use plan for the corridor does not indicate a significant change over the existing land uses to warrant a continuation of the observed historical growth rates. The applied growth rates recommended are as follows: 2.4 percent compounded annually for link volumes and intersection turning movement counts except for the through movement on Okeechobee Road, where a 2.7% annual growth rate is recommended. |